Q3 Review | 2018

Fortress Asset Management

Economic and Investment Review


Economic Growth
:

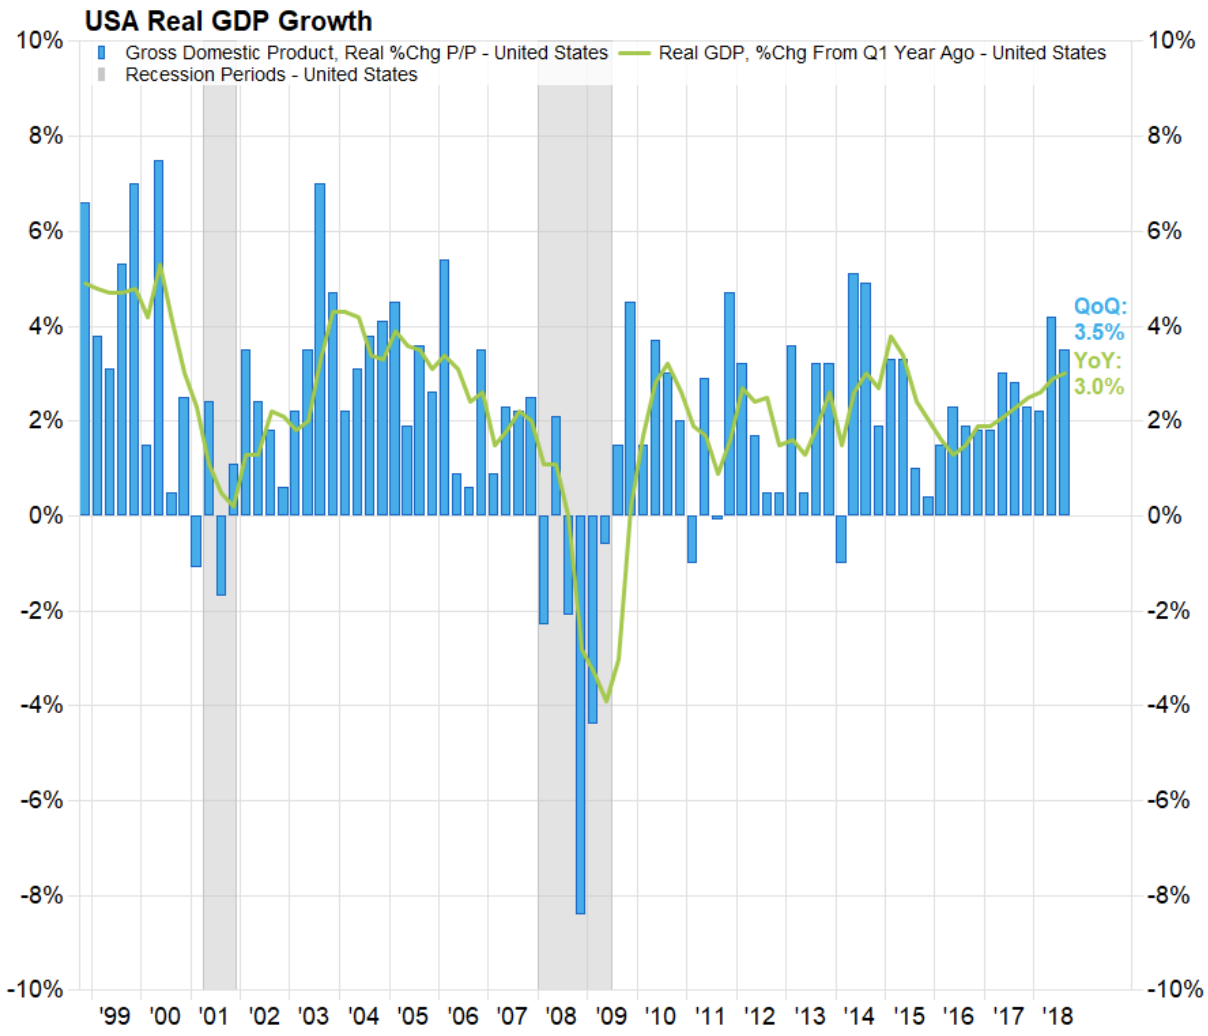
        The U.S. economy continued to show strong growth in the third quarter. The gross domestic product (GDP) grew at a 3.5% annual rate compared with the consensus estimate of 3.4%. This follows an even stronger 4.1% for the previous quarter. It was also the strongest third quarter since 2014. The consensus estimate for the full year has been pushed from 2.50% at the beginning of the year to 2.90% currently. This compares very favorably with 1.6% in 2016 and 2.2% in 2017 and with the long-term average of 3.2%.


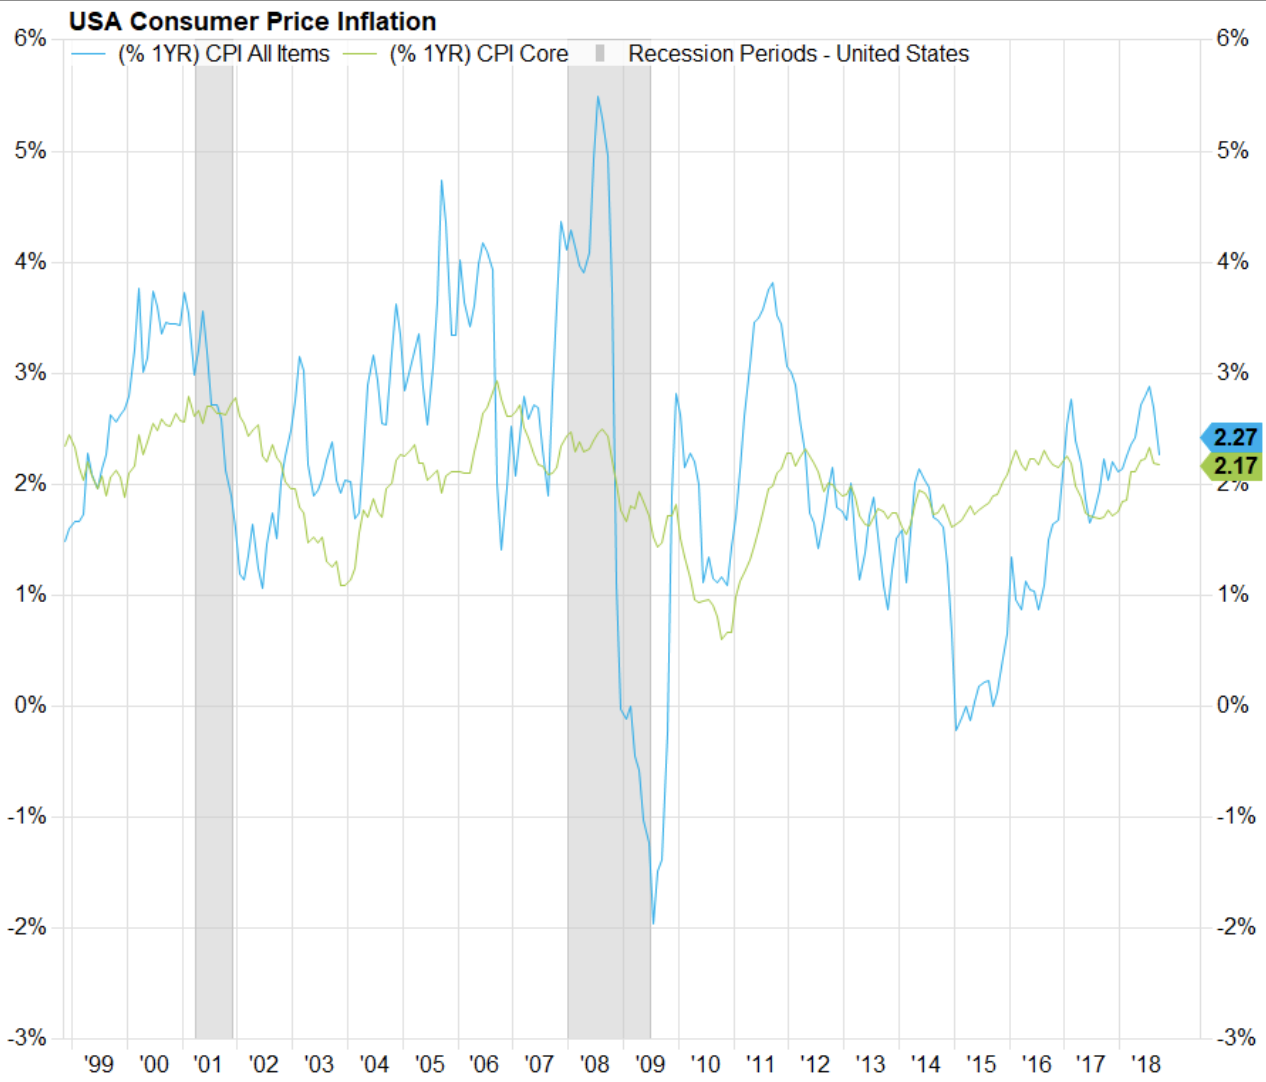
USA Consumer Price Inflation
Source: FactSet
Q3 Economic Growth
Source: FactSet

        Growth in GDP is primarily being driven by an increase in consumer spending and to a lesser extent by an increase in government spending. The strong economy and low unemployment have finally led to an increase in wage growth. The Labor Department reports that wages and salaries paid to private-sector U.S. workers rose 3.1% in the third quarter over the previous year. This is the strongest year-over year gain since the second quarter of 2008. Wages for hourly workers were also up 3.1% while the unemployment rate of 3.7% is the lowest rate since 1969. The Wall Street Journal states that “Unemployment rates below 4% are extremely rare in 70 years of modern record-keeping. The two longest sustained periods came during the Korean and Vietnam Wars.” This is good news for workers in both nominal and real terms. Wage growth exceeded the increase in prices for the quarter as indicated by the consumer price index (CPI).
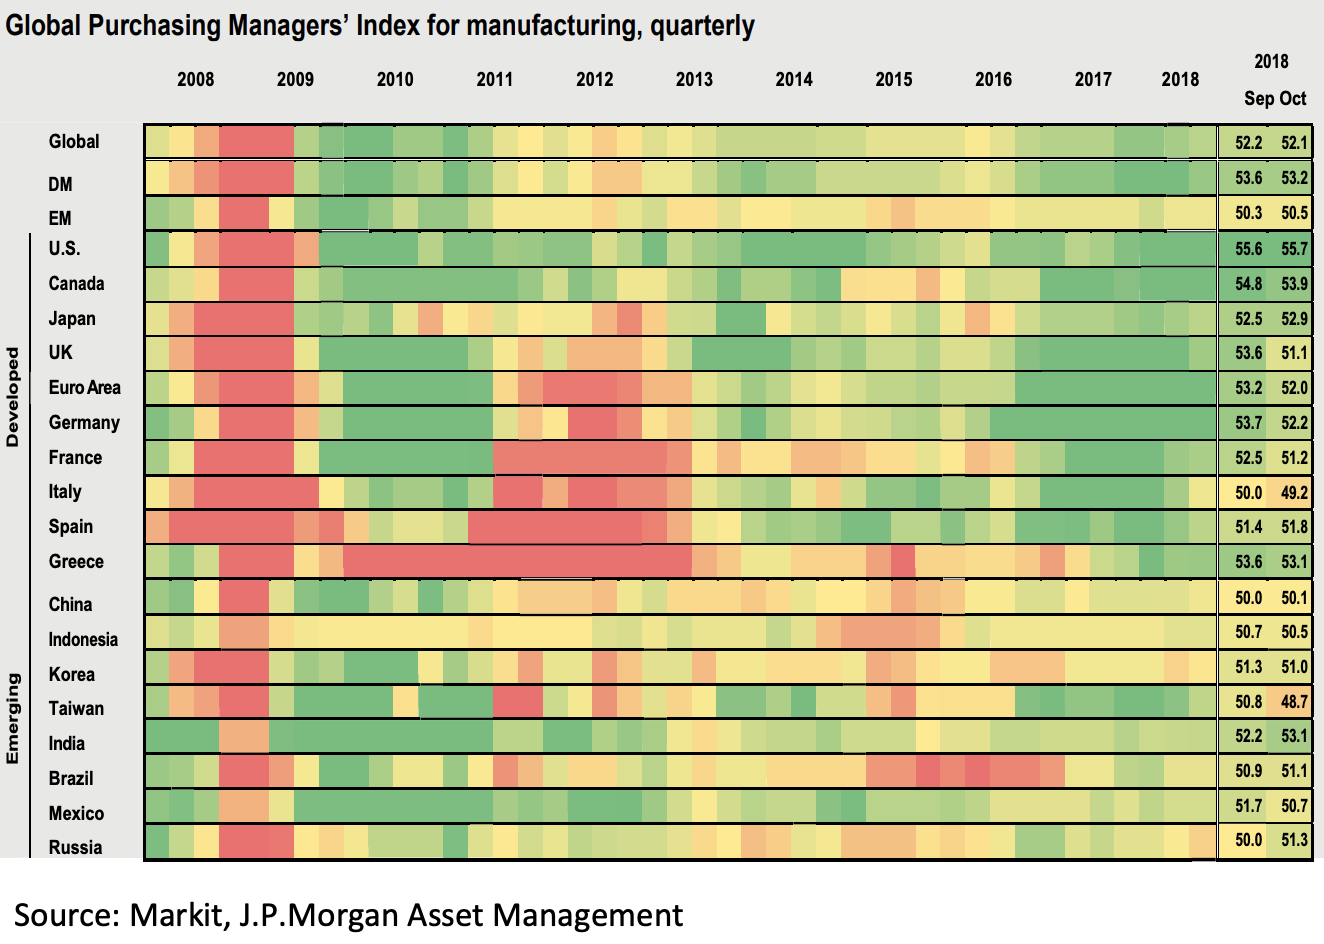
The CPI core rate was 2.17% for the quarter, in line with the consensus estimate of 2.20% for the full year – 2018. Higher real wages and tax cuts have led to a wide range of additional consumer spending. Third quarter consumer spending was stronger than expected, however business spending was weaker than expected. Businesses are hesitant to increase spending in the face of ongoing trade tensions. There is still considerable focus on trade and tariffs with China; however, conditions should improve following trade agreements with Mexico, Canada and South Korea. Government spending also rose in the third quarter due in part to an increase in defense spending. Recent Goldman Sachs research points out that the global operating environment is solid. They find that 93% of countries have growing economies and 49% of countries are experiencing accelerating growth. Domestically, the ISM Purchasing Managers Index has exceeded 55 for twenty-one consecutive months. Any reading above 50 indicates growth so at 55+ the country is experiencing considerable growth in manufacturing. The Global Purchasing Managers’ Index for manufacturing shows impressive global expansion particularly in the U.S. and Europe.
Global Purchasing Managers’ Index for manufacturing
Sustainability of improved economic growth is in question due to the lack of support from worker productivity. Growth in the workforce and growth in worker output determine productivity. Growth in the workforce is relatively slow and growth in output per hour for workers in nonfarm business remains below historical norms. However, there is some thought that output is not being captured accurately in a more digitized economy. The Federal Reserve (Fed) as well as most economists do not believe that the current rate of growth will continue through 2019. The Fed forecasts a growth rate of 2.5% and economists expect a growth rate of 2.4% (consensus estimate) for the upcoming year


Interest Rates:


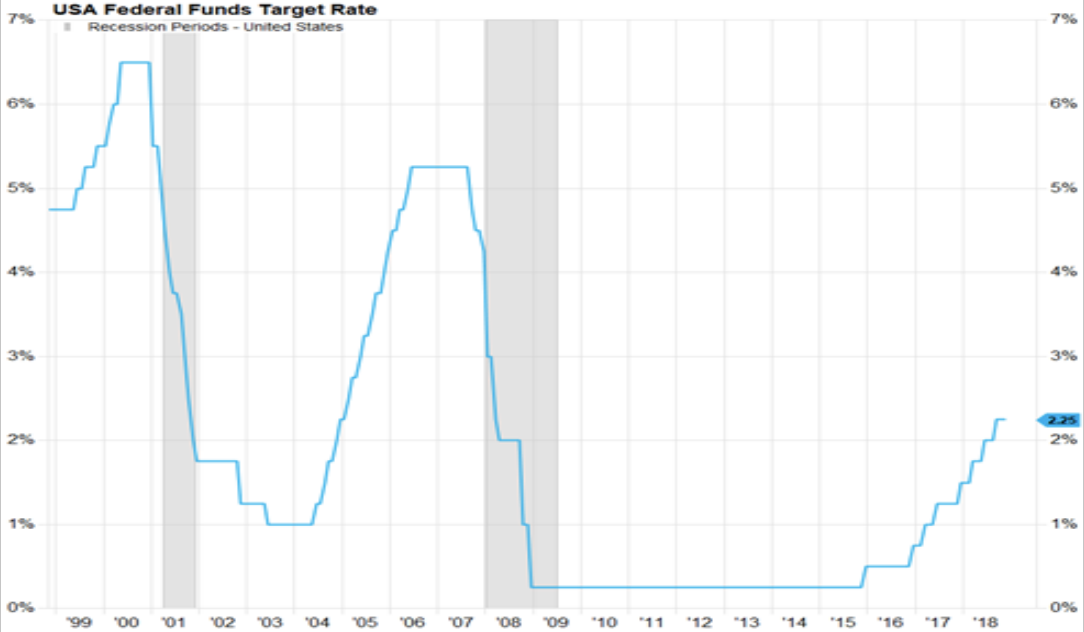
The Fed has raised the federal-funds target rate three times so far this year to a range of 2.00-2.25%.


USA Federal Funds Target Rate
Source: FactSet
        It is generally expected that the Fed will increase the rate by an additional 0.25% in December. Economists and Strategists generally expect that the Fed will continue to follow the pattern of periodic 0.25% rate increases in 2019. Federal Reserve chairman Jerome Powell stated on October 2nd that “Removing accommodation too quickly could needlessly foreshorten the expansion.” The consensus estimate places the Fed Funds rate at just over 3.0% at the end of 2019 indicating three more rate increases for next year. 

        The ultimate target for the Fed Funds rate is called the neutral rate. The Federal Reserve Bank of San Francisco states that “the neutral rate is the point where the federal funds rate goes from being low enough to be accommodative to being high enough to dampen economic activity. The neutral rate is also often defined as the rate or range of rates consistent with full employment, trend growth and stable prices.” Federal Reserve Chairman Jerome Powell has stated that there is a ways to go before reaching the neutral rate. The previous Chairman, Dr. Janet Yellen stated: “Research suggests that the neutral real rate is probably somewhere in a 1.5% to 3.5% range. To get to a neutral nominal rate, we have to add in expected inflation. That probably takes us to a neutral nominal range of around 3.5% to 5.5% at this point.” The consensus estimate indicates that the Fed is likely to push the funds rate to 3.4% by 2020 before the upward trend levels out.

Equity Markets

       
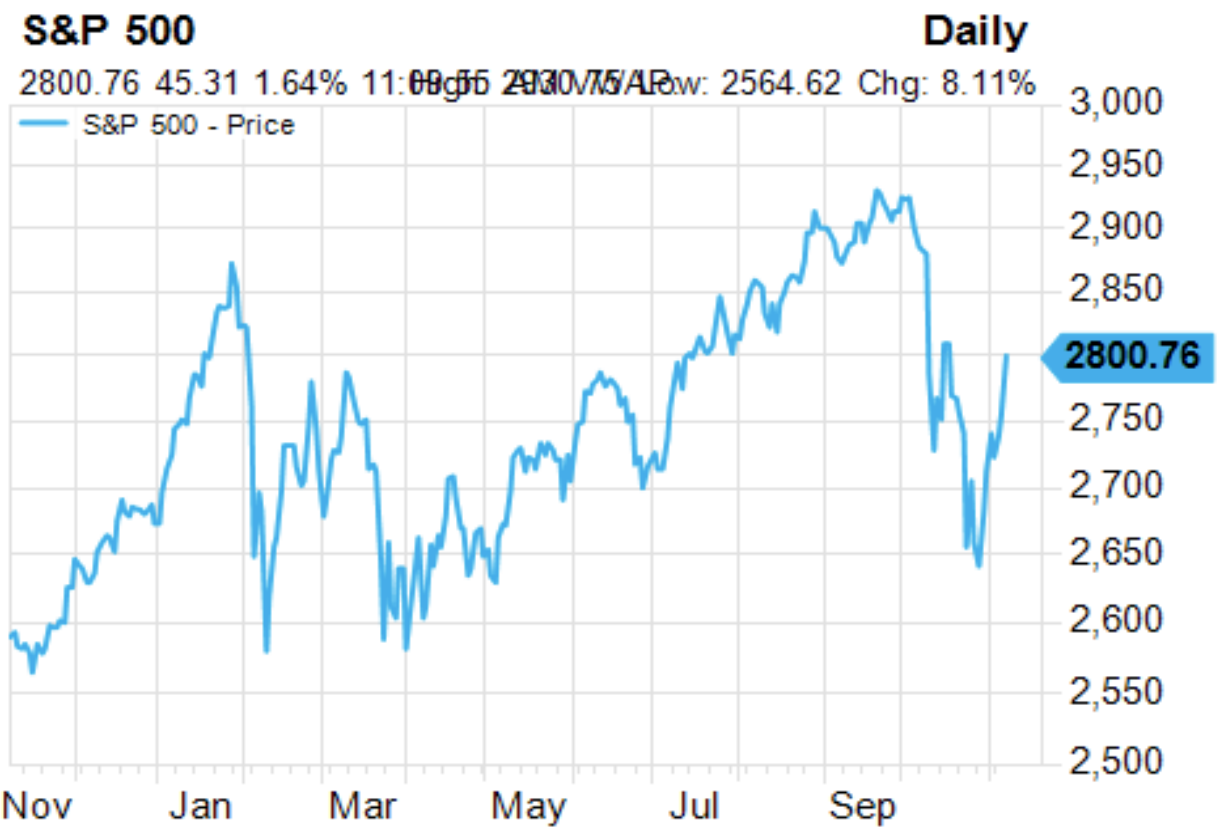
        The S&P 500 was up 7.20% for the third quarter, 8.99% YTD and 15.72% for 1 year ending September 30, 2018. Of course, that is old news now as there has been a correction or near correction in many benchmark indices. The S&P 500 declined 9.7% from its peak on October 3rd (2,925) to the close on October 29th (2,641). The S&P 500 has since regained over 5% of the loss (as of November 7 nd) and is now up over 4% year-to-date and over 8% for one year on a total return basis.
S&P 500 Price
Source: FactSet
A number of factors can be pointed to when identifying what has caused the decline:

• Peak earnings growth concerns. – S&P 500 EPS growth is expected to peak at about 22% in 2018 and drop to about 10% in 2019 (still an above average growth rate).

• Fed tightening. – The Fed Funds target rate range is currently 2.00 - 2.25%. An additional 0.25% increase is expected in December and three 0.25% increases are expected in 2019.

• China growth slowing. – China’s official manufacturing PMI fell to 50.2 in October from 50.8 in September, below 50.6 consensus. Lowest reading since July 2016.

• Trade and tariffs. – No near-term trade deal is expected with China.

• Geopolitical tensions. – Saudi Arabia, Russia, Iran.

• Election related volatility. – Democrats have taken the House and investigations may ramp up.

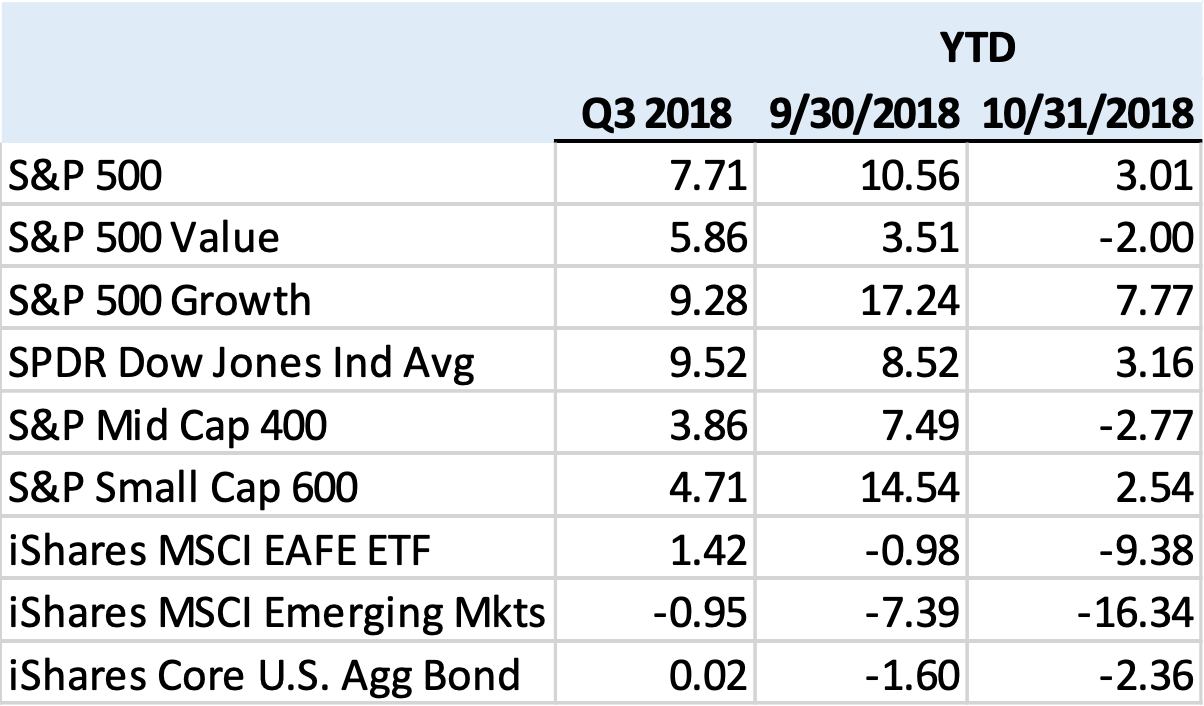
        Value stocks have fared slightly better than growth stocks in the recent downturn but still lag significantly year-to-date and over 12 months and longer. There is a wide discrepancy in economic sector performance. Six of the ten sectors have negative returns on a year-to-date basis and four are positive. The six negative sectors are Communications Services, Materials, Industrials, Financials, Energy and Consumer Staples. The four positive sectors are Utilities, Information Technology, Health Care and Consumer Discretionary.


        Mid Cap stocks represented by the S&P MidCap 400 Index continue to trail their large cap counterparts. The S&P MidCap 400 was up 3.86% in the third quarter but was down -2.77% year-to-date through October 31. Small Cap stocks represented by the S&P SmallCap 600 Index were up 4.71% in the third quarter and remained positive on a year-to-date basis through October 31 at 2.54%.
Source: FactSet
        Both developed and emerging international markets have suffered greatly through both the ups and downs of the domestic market. International equities have performed poorly as investors have focused more on the impressive growth rates of the U.S. economy and corporate earnings. Another headwind, or perhaps gale force wind, has been the impact of the higher dollar resulting from the Fed raising rates in a backdrop of low and even negative international interest rates. Slower growth in China and the addition of tariffs and trade conflicts have also negatively impacted international and particularly emerging markets. The MSCI EAFE Index, representing international developed countries, declined -9.4% year-to-date through the end of October. The MSCI Emerging Market Index was down -16.3% for the same time period.

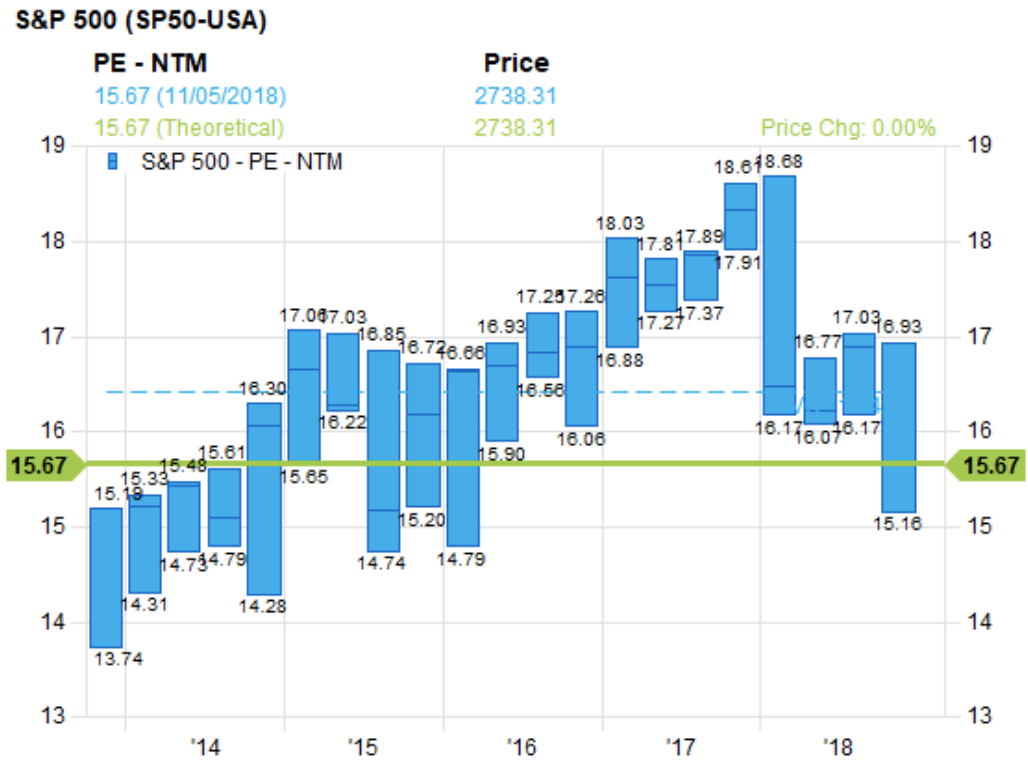
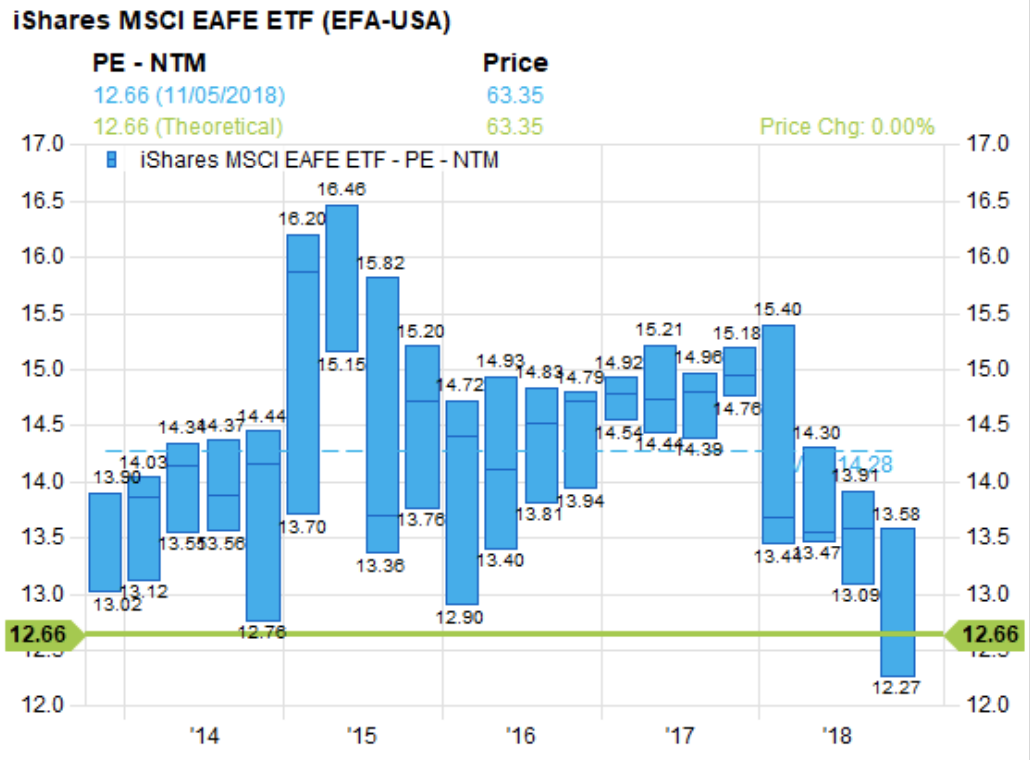
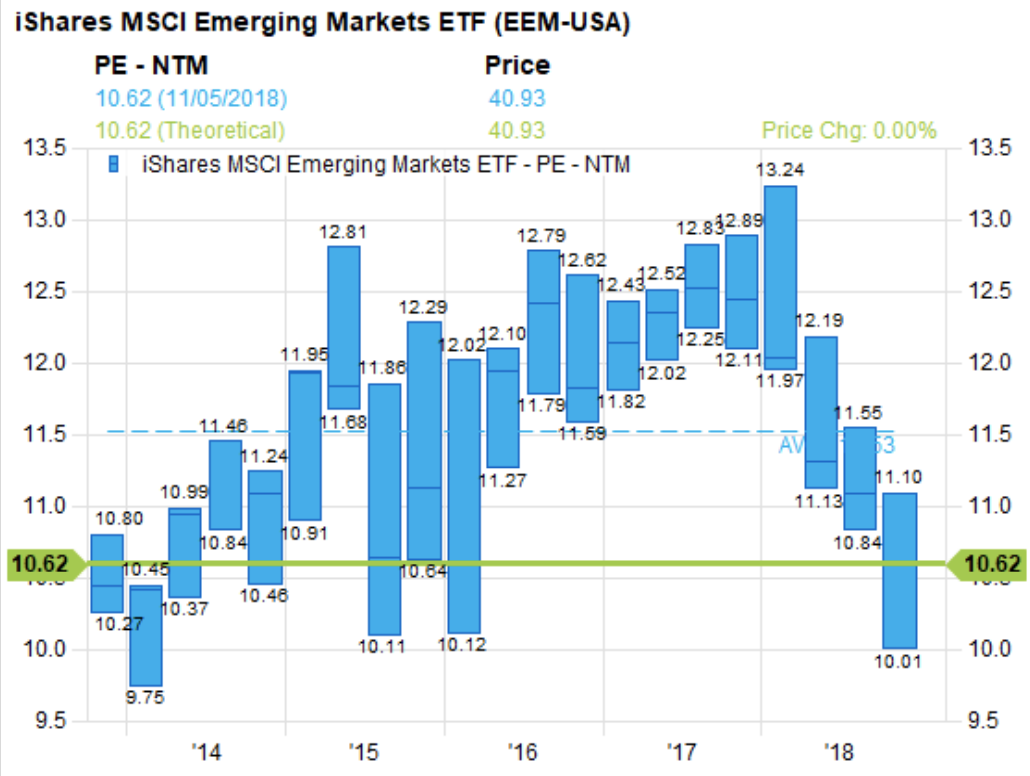
        Valuations for international markets look more attractive than domestic markets but this can remain the case for extended periods of time. The S&P 500 is trading at a 15.7x P/E based on the next twelve months of expected earnings compared with 12.7x for the MSCI EAFE Index and just 10.6x for the MSCI Emerging Market Index. Arguments for the difference in valuation multiples include political stability, legal system stability, stock market liquidity and variation in currency risk. On a relative basis, the S&P 500 is trading at over 95% of its five-year average P/E compared with 89% for international developed markets and 92% for emerging markets utilizing next-twelve-months earnings estimates.
iShares Chart
Source: FactSet
iShares Chart 2
Source: FactSet
iShares Chart 3
Source: FactSet
The 2018 S&P 500 estimate of 22% earnings growth compares with estimates of 6.9% for international developed markets (as represented by MSCI EAFE) and 14.2% for emerging markets (as represented by MSCI EM). Investors are beginning to turn their focus towards 2019 and beyond. Earnings growth for the S&P 500 is expected to decline to 9.2% in 2019 compared with 7.7% for international developed markets and 11.2% for emerging markets. Forbes estimates that “on a long-term basis, earnings growth for emerging markets should be around 10+% and long-term earnings growth for the S&P 500 should be around 6%”.

There are 2,876 companies listed in the MSCI Emerging Market Index, with 38% of the market cap in China, followed by 10.9% in India and 8.7% in South Korea. The challenge with emerging markets earnings is that they can be quite volatile. Forbes reports that “the long-term standard deviation of the MSCI Emerging Markets Index is 22%, while the S&P 500 Index has a long-term standard deviation of 15%”. Investors should be prepared for more ups and downs with emerging markets equity investments, however a modest allocation to diversified portfolio with a longer-term horizon may improve returns.

Our twelve-month forecast for the S&P 500 Index is 3,000 indicating an upside of just over 7% from current levels. The forecast is based on slightly lower than consensus earnings growth and a 17.25 P/E multiple

Fixed Income Markets

        Fixed Income markets continue to be negatively impacted by upwardly trending interest rates. The Bloomberg Barclay US Aggregate Bond Index was just above water at 0.02% in Q3 and declined -2.36 year-to-date through October 31. The Bloomberg Barclays Municipal Bond Index was up 0.08% in Q3 and down -1.01% year-to-date through October 31. Shorter duration benchmarks such as the Bloomberg Barclays 1-5 Year Credit Index and the Bloomberg Barclays 1–5 Year Municipal Index are both still positive on a year-to-date basis.

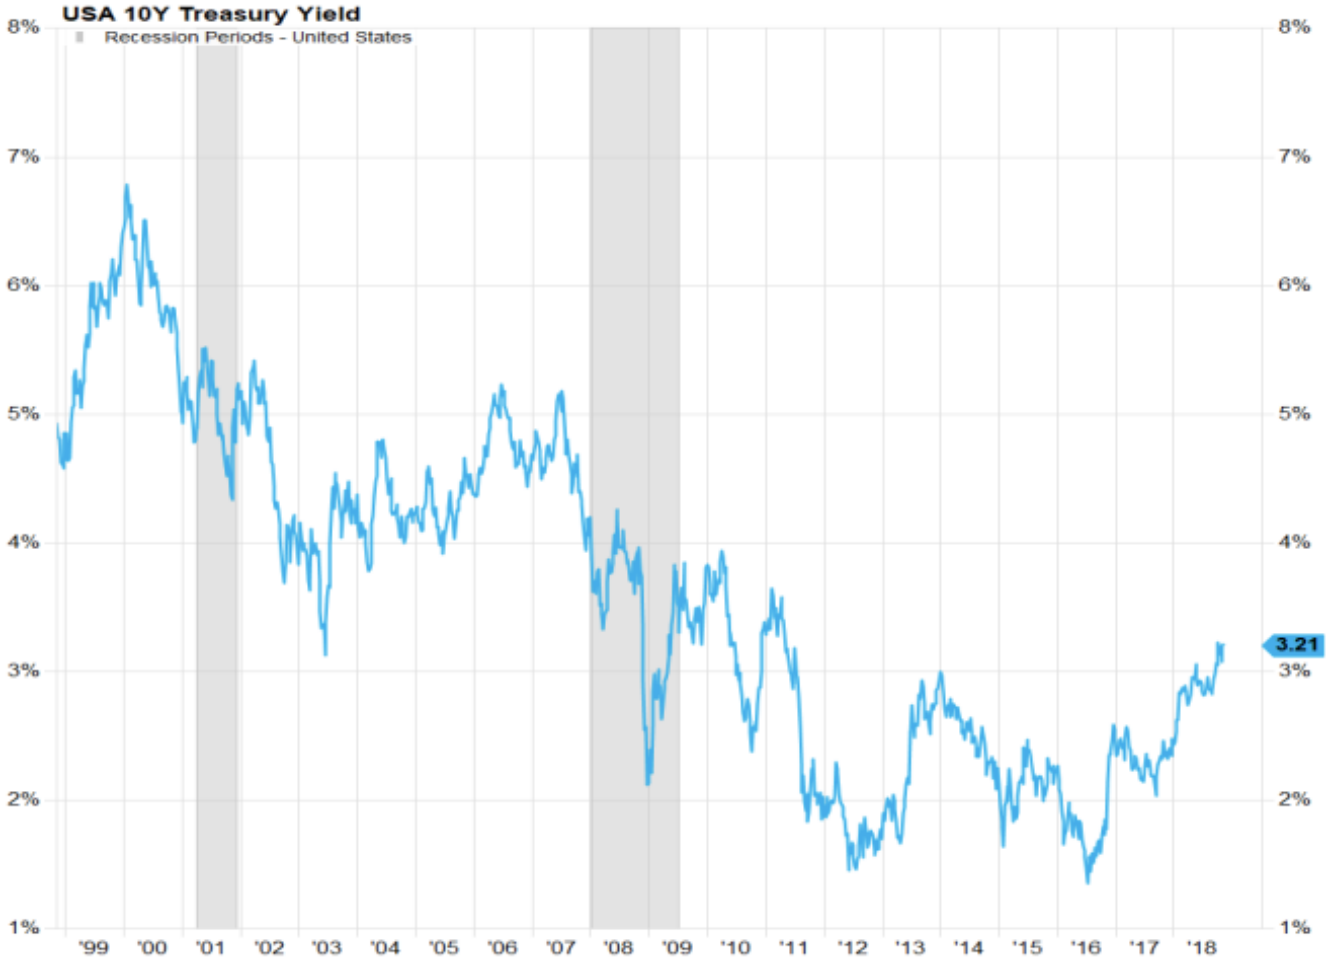
The 10-Year U.S. Treasury has moved over the past two years from a low of 1.45% in 2016 to 3.21% currently.


US 10-Year Treasury Yield
Source: FactSet
   
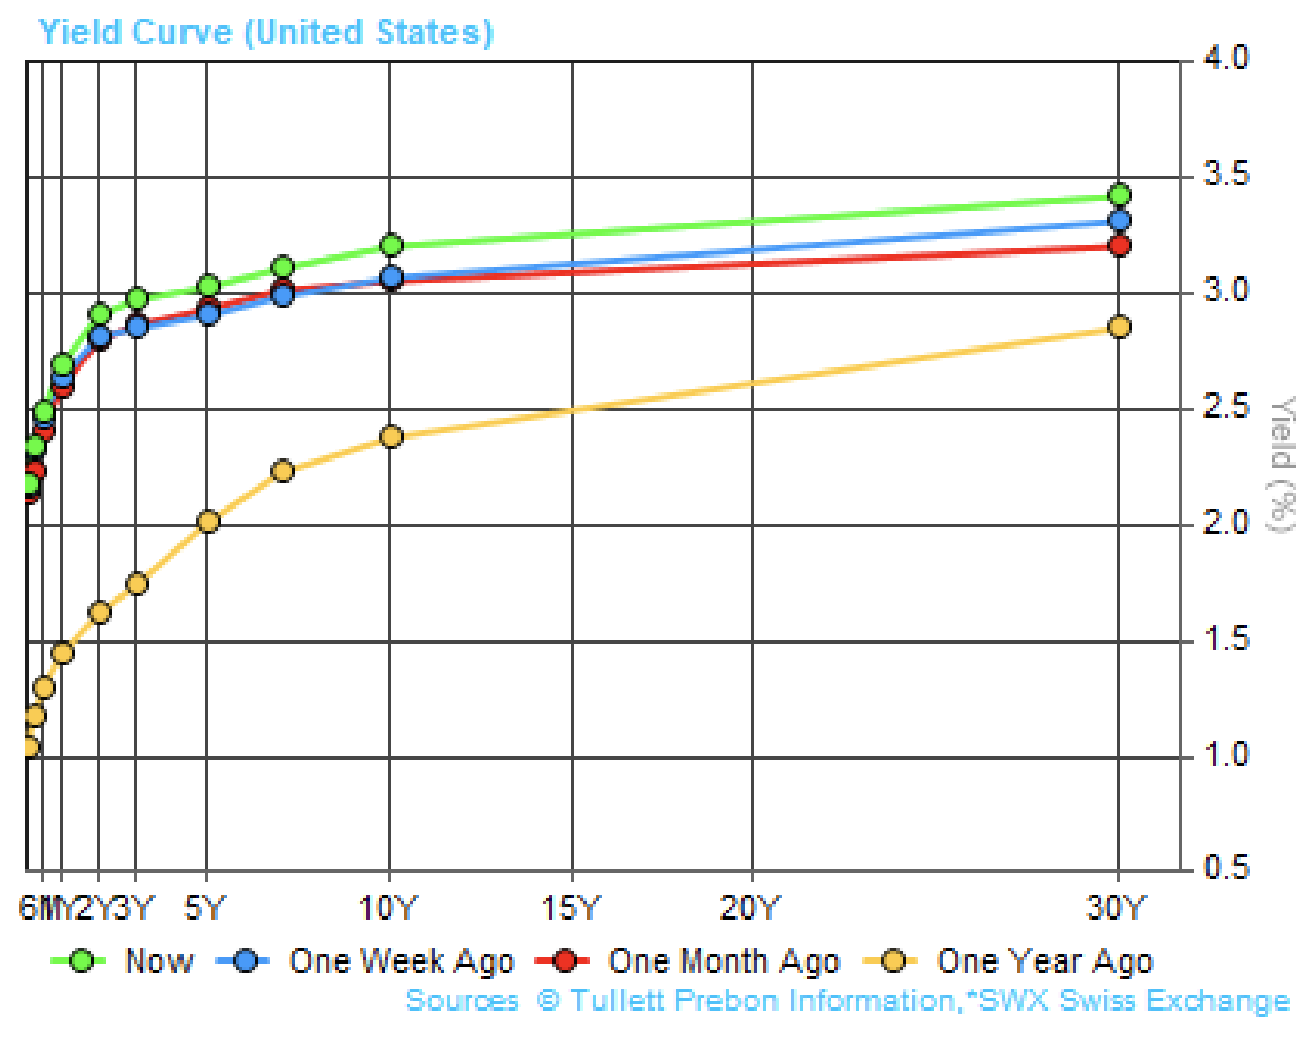
    The entire U.S. Treasury Yield Curve has moved higher and become flatter over the past year in response to increase in the Fed Funds rate and due to expectations for greater inflationary pressures in the future.
Bond investors enjoyed price appreciation and the total return benefit produced by twenty-five years of declining rates through mid-2016 but did not enjoy the reduced income production. The current trend is causing just the opposite to occur – prices are declining but income is increasing. The problem is that the increase in income lags the decrease in price and may not be sufficient to offset the price decrease over a given period of time. Investors should try to remember that the primary purposes for holding fixed income securities are produce income and to provide a tool to help manage portfolio volatility.

There is some question as to whether interest rates will continue to increase. Arguments for minimal-tono interest rate increases over the next several years include the lack of inflationary pressures, the gap in international and domestic interest rates and the potential for a recession in 2+ years. Arguments for higher interest rates include ongoing Fed Funds “normalization”, the potential for economic overheating and wage growth and the resulting expectations for increased inflationary pressure. We lean towards the latter argument and recommend reducing a portfolio’s sensitivity to interest rates through a reduction in duration and/or the use of individual bonds with final maturities.
Disclosures

        This commentary is provided for informational and educational purposes only. The information, analysis and opinions expressed herein reflect our judgment as of the date of writing and are subject to change at any time without notice. They are not intended to constitute legal, tax, securities or investment advice or a recommended course of action in any given situation. Forecasts, estimates, and certain information contained herein are based upon proprietary research and should not be considered as investment advice or a recommendation of any particular security, strategy or investment product. Investing in the markets is subject to certain risks including market, interest rate, issuer, credit and inflation risk; investments may be worth more or less than the original cost when redeemed. No part of this article may be reproduced in any form, or referred to in any other publication, without express written permission.
        All investments carry certain risk and there is no assurance that an investment will provide positive performance over any period of time. Information obtained from third party resources are believed to be reliable but not guaranteed. Past performance is not a guarantee or a reliable indicator of future results. Mark Anderson, Brock Bowden, Barbara Faulkner, Mark Johnson, and Don Wiscomb are all investment advisor representatives of Dynamic Wealth Advisors, a registered investment advisor. All investment advisory services are offered through Dynamic Wealth Advisors.