Q4 Review | 2018

Fortress Asset Management

Economic and Investment Review


Economic Growth:

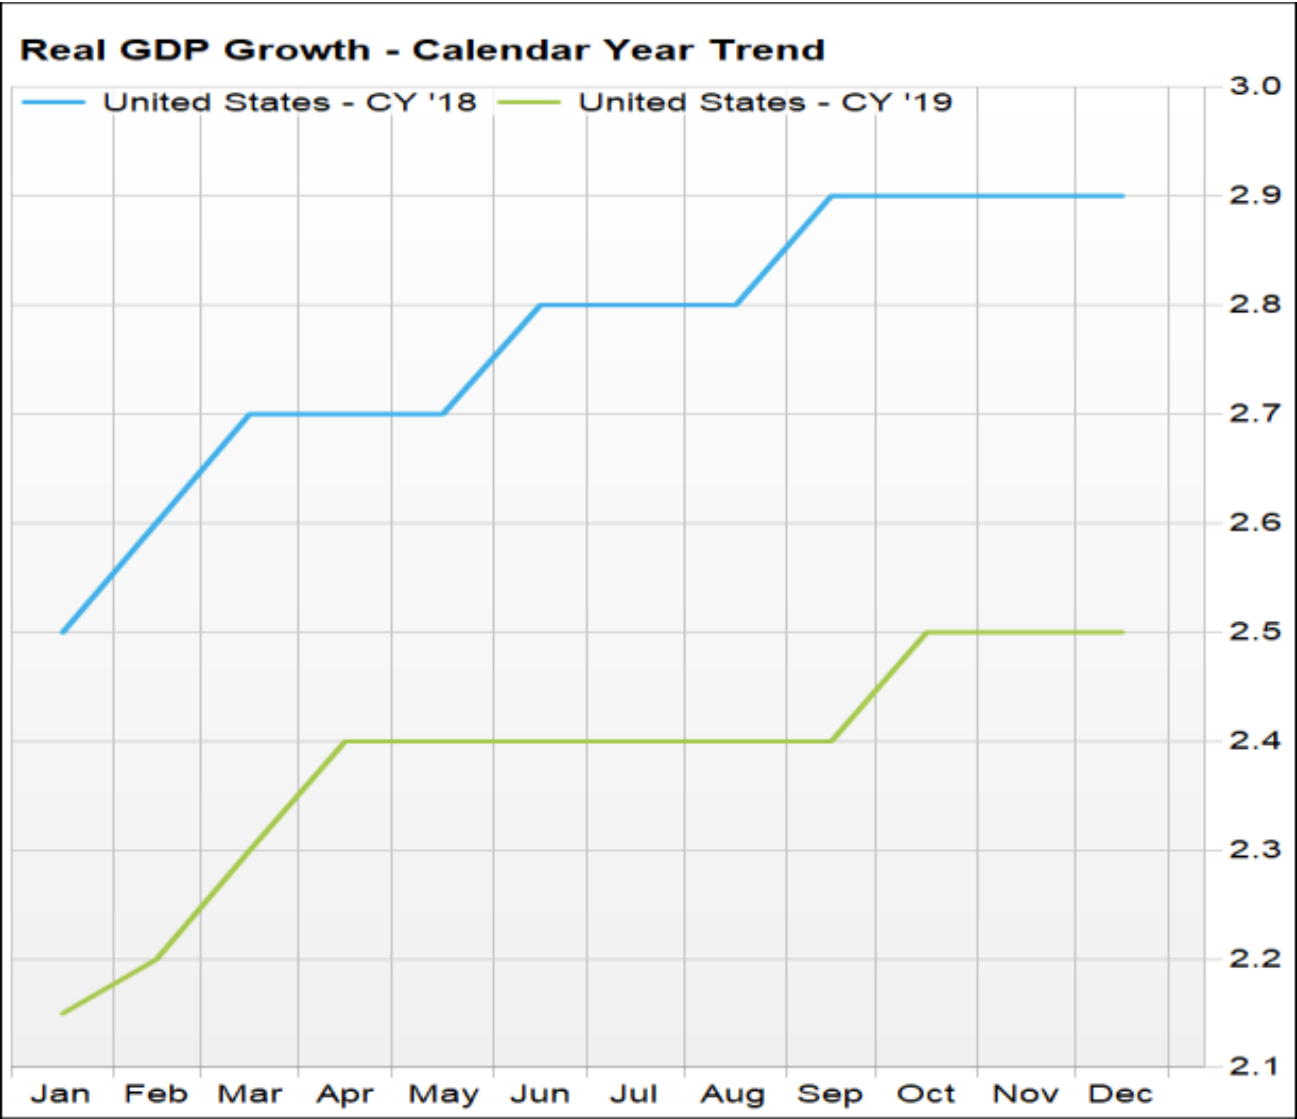
       The current consensus estimate for gross domestic product (GDP) in Q4 2018 is 2.7% and 2.9% for calendar year 2018. If the annual estimate is realized, it will tie with 2015 for the highest rate of growth in over ten years. However, to put the number into perspective, it still comes in below the long-term average of 3.2%. The consensus estimate for the full year rose from 2.50% at the beginning of the year to 2.90% currently. Growth in 2019 is not expected to reach the same level. The current estimate for 2019 is 2.5%, up from 2.15% at the beginning of 2018.
Economic Growth Chart
Source: FactSet
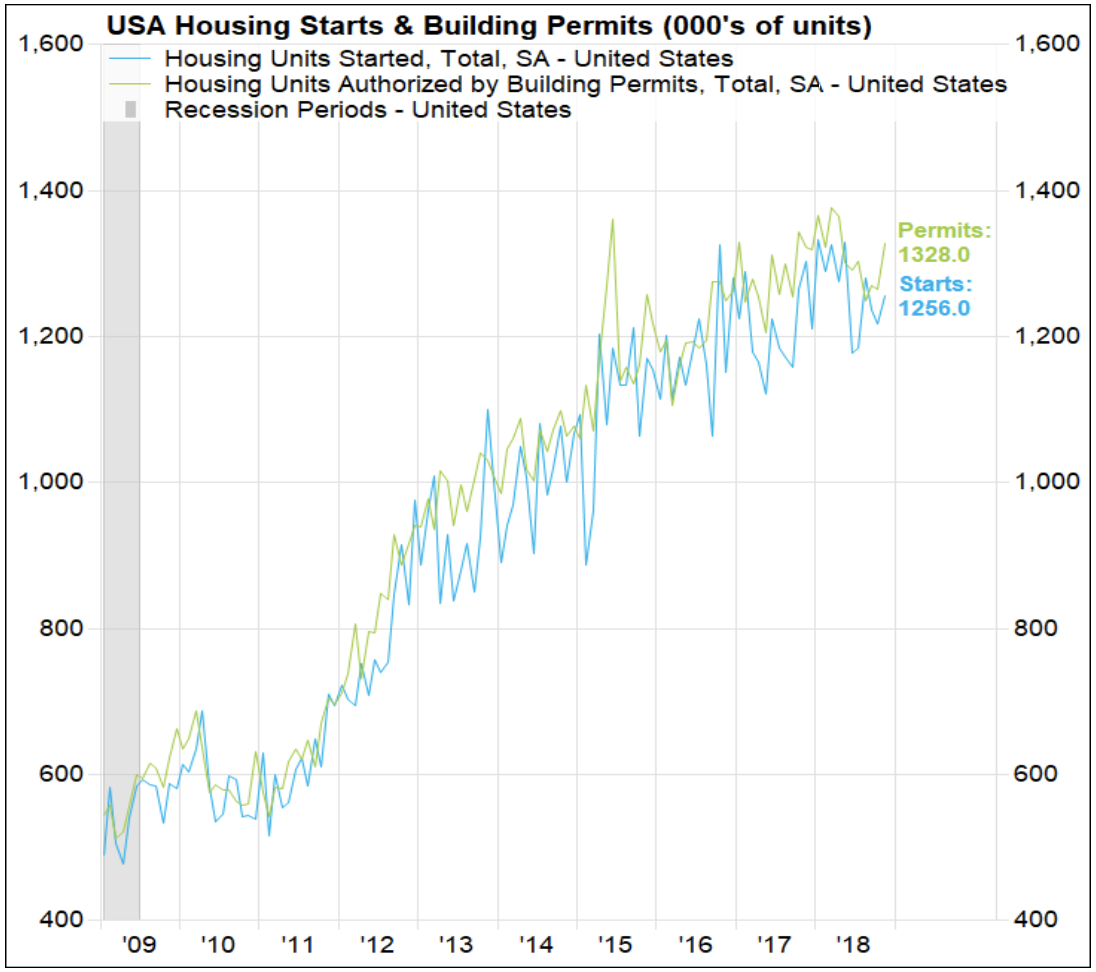
Chart of US Housing Starts and Permits
Source: FactSet


        The rate of economic expansion is expected to slow in 2019 due to higher interest rates, reduced business investment and a slower housing market. A Federal Reserve report known as the beige book released on January 16th indicates that businesses are less optimistic about the future due to higher borrowing costs, trade wars, stock market volatility and the government shutdown. Housing starts and permits declined somewhat in 2018 but remain at elevated levels.


      The demand remains but prices and mortgage rates may have pushed some potential buyers to the sidelines. A recent separate Fed report identifies student loan debt as having a negative impact on many first-time buyers.

      The current economic expansion, or the time since the last recession, will very likely set a new record following the second quarter. Many investors and business leaders are placing themselves on higher alert for the next recession partly due to the extended period of expansion. However, the probability of entering a new recession is not determined by the length of time since the previous recession. The Wall Street Journal reports in a January 16, 2019 article that “the possibility of a 2 global recession ranks as the top concern on the minds of corporate leaders as they head into 2019.”

      If the length of time of an expansion is not a factor in predicting a recession what should we look for? Raymond James Chief Economist Scott Brown stated in the Economic Outlook 2019 published December 21, 2018, “Every downturn has its own characteristics. The stage is typically set for a recession through a period of over-investment or mal-investment, often fueled by increased leverage. Federal Reserve policy is frequently a factor, but that could be either from raising short-term interest rates too rapidly or by having previously raised them too slowly (and then having to play catch-up).”

      Whether or not we are in a period of over-investment is up for debate. Backward looking valuation measures such as the P/E 10 ratio (Cyclically Adjusted Price Earnings or CAPE ratio or the Shiller PE ratio) indicate relatively high valuations ratios; however, forward looking valuation measures still appear reasonable.

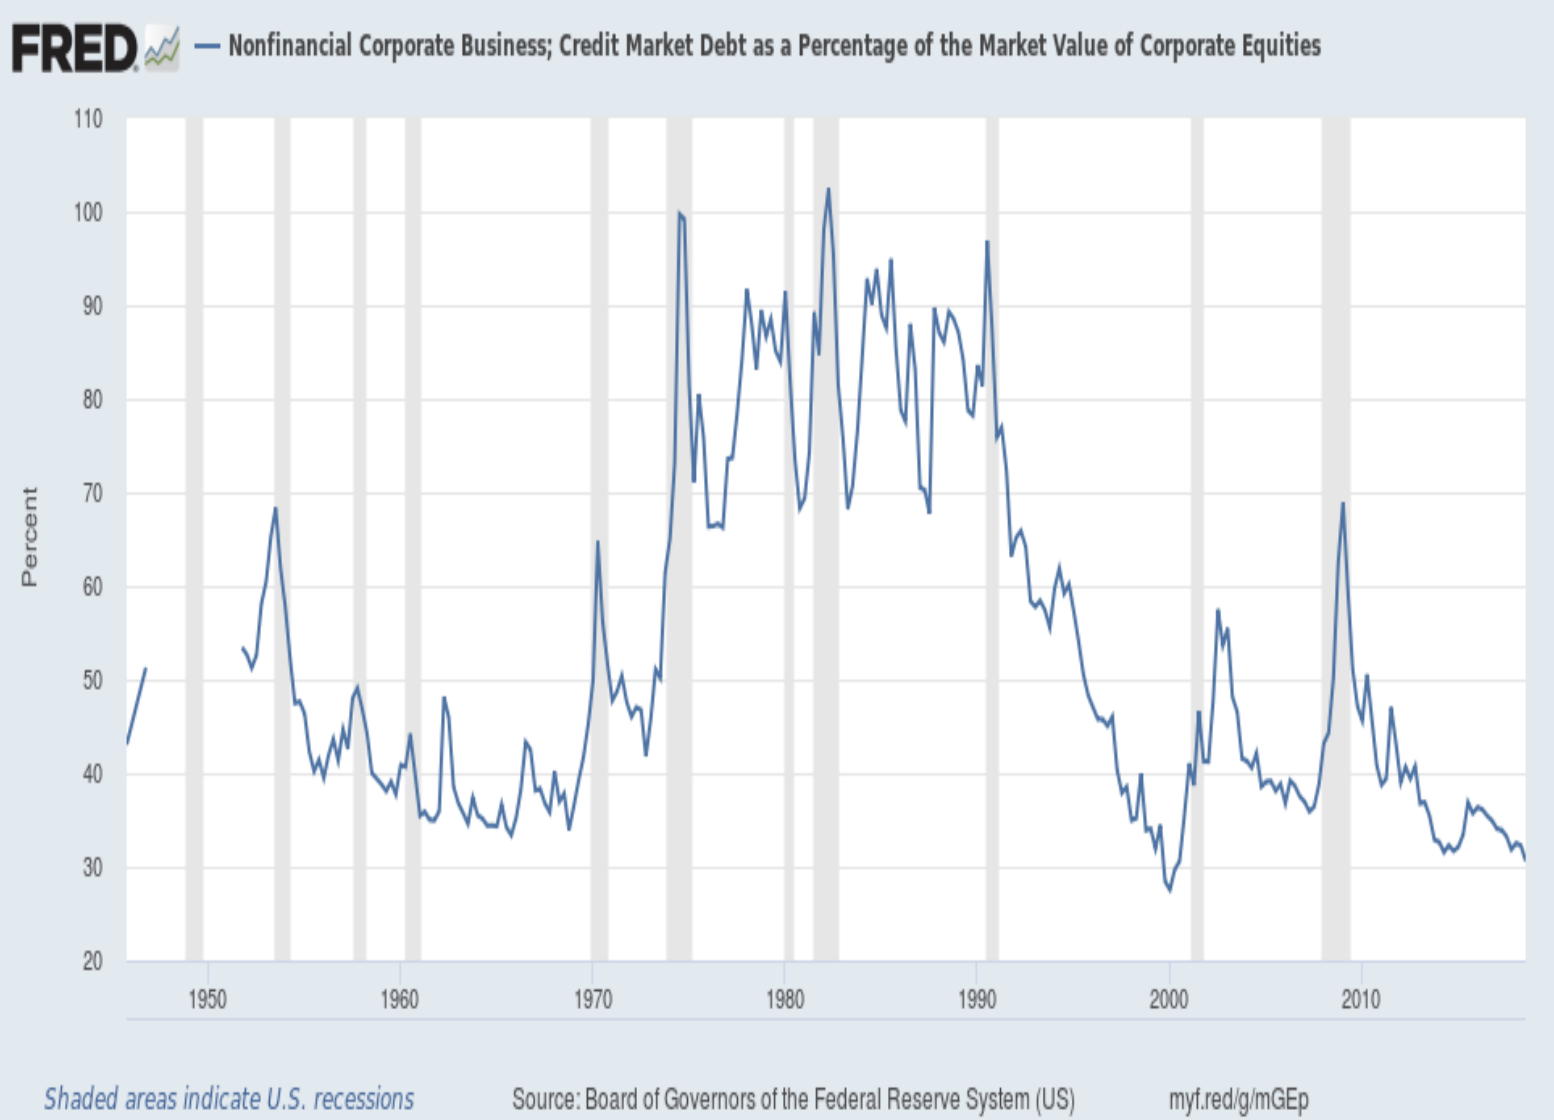
      It has been widely publicized that corporate debt is at all time highs. However, this has almost always been the case at any point in time. Conversely, corporate debt as a percentage of the market value of corporate equities is near historic lows.
Credit Market Debt Fortress Asset Management
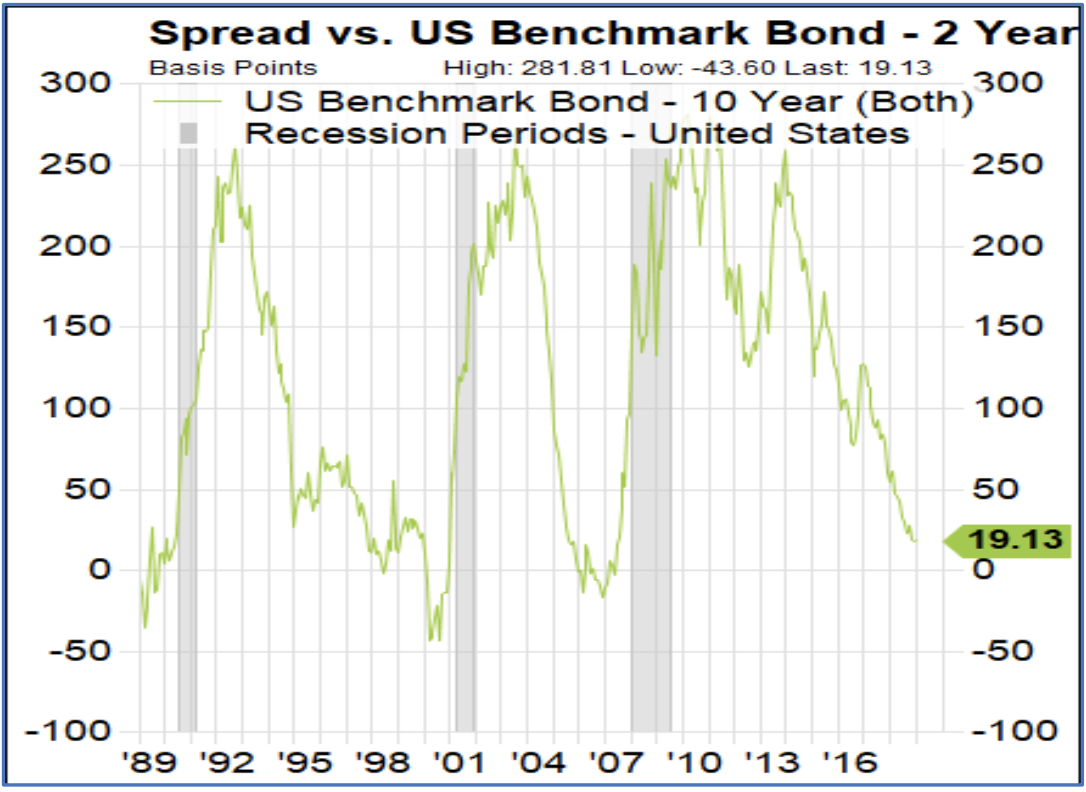
      The Federal Reserve raised the Fed Funds rate a total of four times in 2018 from 1.50% to 2.50%. It is widely expected that the Fed will raise rates twice more in 2019 to 3.00%. Investors took some solace when Fed Chairman Powell indicated the policy would be flexible and that the central bank could afford to be patient in deciding when to raise rates. Several Fed presidents have indicated that a pause in rate increases would be appropriate. The 10-Year U.S. Treasury currently has a yield of 2.75% or just 0.25% above the Fed Funds rate. Investors fear that additional Fed Fund rate increases may invert the yield curve, meaning that rates for short maturities would be higher than rates for long maturities. An inverted Treasury yield curve has been a consistently good predictor of economic recessions.
US Benchmark Bond - Investment Management
Source: FactSet
      Even though inverted yield curves appear to predict recessions, this does not necessarily mean that they cause recessions. One of the explanations may be related to bank loans. Banks borrow short through deposits and lend long. If the spread between what banks pay for deposits and receive for loans gets squeezed, profitability suffers. In this scenario banks would likely reduce lending, reducing liquidity in the system, causing a drag on economic activity which could lead to a recession. However, banks are notoriously slow in adjusting deposit rates up and typically base loans off 3 of the prime rate which is currently 3.0% higher than the Fed funds rate and has adjusted up in lock-step with the Fed Funds rate.

      Inflation is expected to remain subdued in 2019. The consensus estimate for core CPI is 2.2% for the year and Raymond James forecasts the PCE Price Index to show an increase of 2.1% for 2019. If the numbers play out this way, it should give the Fed some flexibility.

      Global growth forecasts for 2019 are trending down. The International Monetary Fund (IMF) cut its forecast to 3.5%, down from 3.7% in October and 3.9% in July. The IMF’s Managing Director Christine Lagarde indicated that a global recession isn’t around the corner “but the risk of a sharper decline in global growth has certainly increased.” China reported 2018 GDP of 6.6%, the lowest level since 2009. The U.S.-China trade conflict along with softer global demand has been a drag on GDP. It is also interesting to note that some of the decline is due to reduced government borrowing and spending in an effort to hold down debt and related financial risks. The consensus estimate for 2019 GDP is 6.2%. Estimates for future years indicate that the downward trend is expected to continue beyond 2019. Still, most of the rest of the world would be doing cartwheels over this level of growth. The next largest countries in order of GDP ranking; Japan, Germany and the United Kingdom expect GDP growth to be in a range of 0.9-1.6% in 2019.

Equity Markets

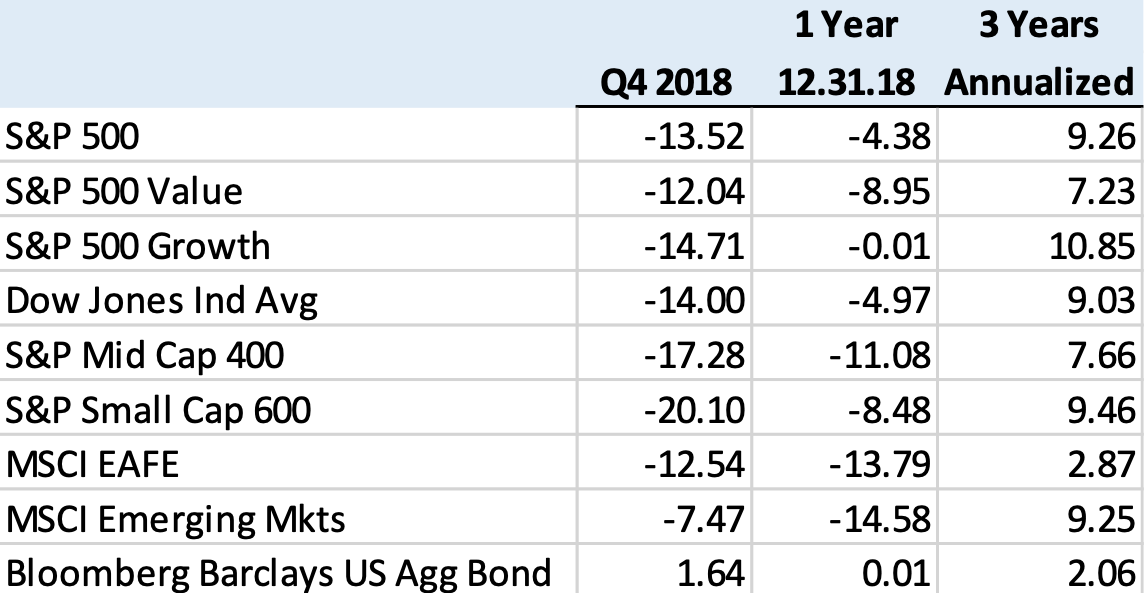
      The S&P 500 was down 13.5% for the fourth quarter and down 4.4% for the year. The correction was largely blamed on a combination of increasing interest rates, the expectation for slower earnings and global economic growth in 2019, the potential for peak margins and trade tensions. Mid Cap and Small Cap stocks were even more sensitive to the news flow than their Large Cap counterparts. The S&P Mid Cap 400 was down 17.3% for the quarter and 11.1% for the year. The S&P Small Cap 600 was down 20.1% for the quarter and 8.5% for the year.
      International stocks were also punished. The MSCI EAFE index (Developed International) was down 12.5% for the quarter and 13.8% for the year. The MCSI Emerging Markets index was down 7.5% for the quarter and 14.6% for the year. International stocks suffered from the same headwinds as the domestic market but also were impacted by strength of the U.S. dollar. Growth stocks trailed value stocks in the quarter but lead for the year and longer.


Total Return Change Fortress Asset Management
Growth Stocks | Investment Management
Source: FactSet
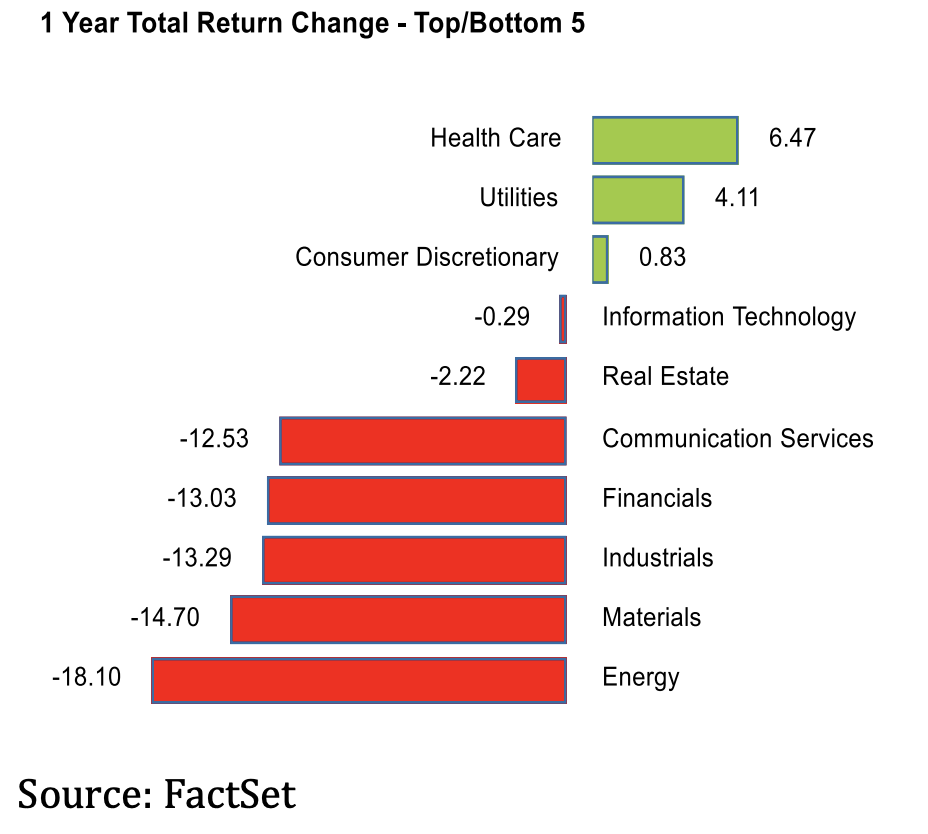
      Only three economic sectors within the S&P 500 had positive returns in 2018 – Health Care, Utilities and Consumer Discretionary. Five sectors had greater than double digit losses. Energy was the hardest hit followed by Materials, Industrials, Financials and Communication Services.

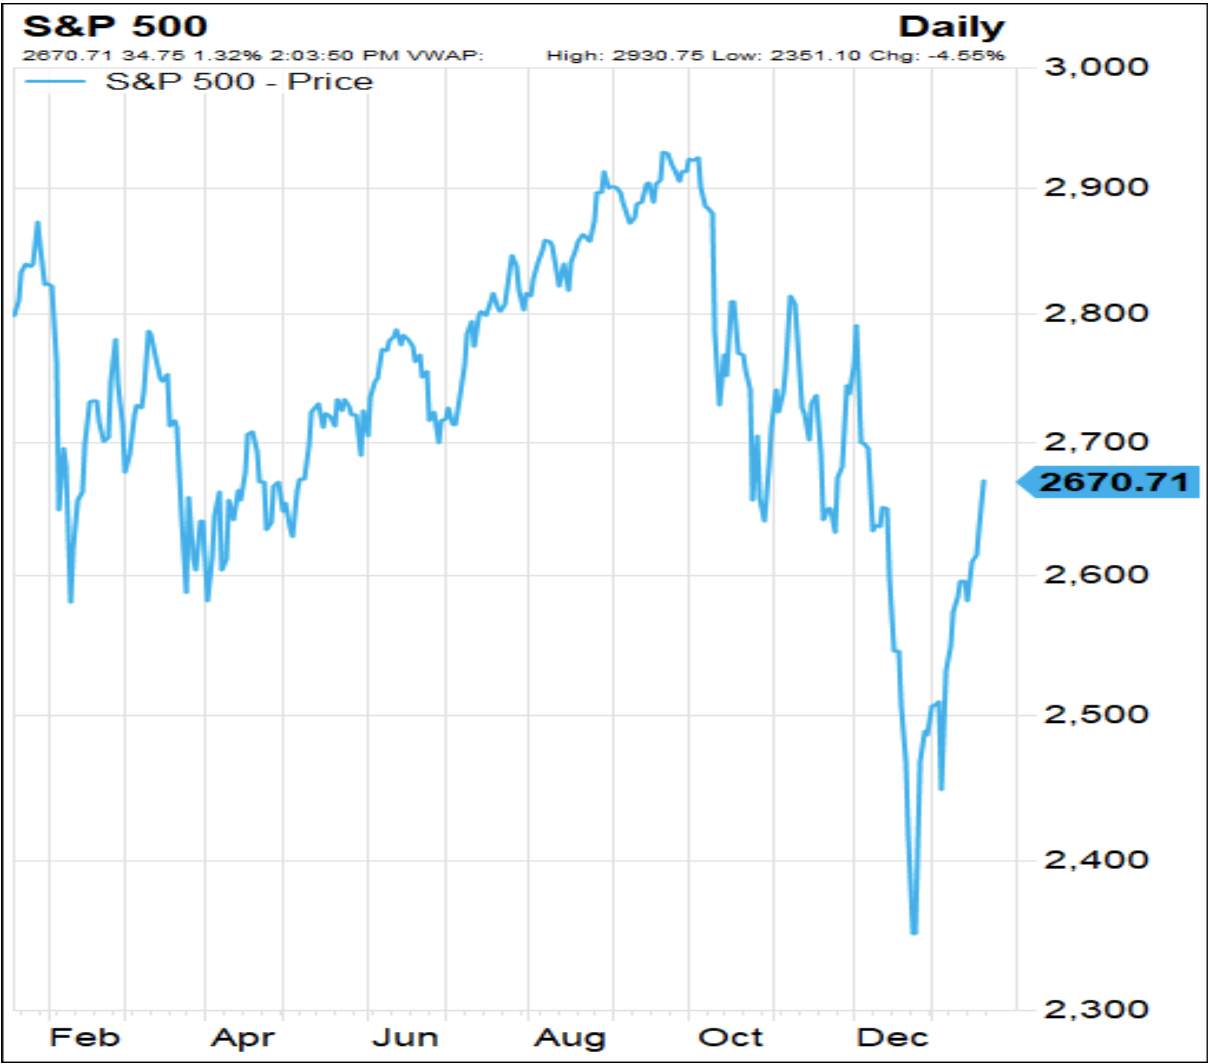
      On a positive note, the equity markets have reversed course through the first three weeks of January in response to less hawkish dialog from the Fed, easing trade tensions between the U.S. and China and 1 Year 3 Years Q4 2018 12.31.18 Annualized S&P 500 -13.52 -4.38 9.26 S&P 500 Value -12.04 -8.95 7.23 S&P 500 Growth -14.71 -0.01 10.85 Dow Jones Ind Avg -14.00 -4.97 9.03 S&P Mid Cap 400 -17.28 -11.08 7.66 S&P Small Cap 600 -20.10 -8.48 9.46 MSCI EAFE -12.54 -13.79 2.87 MSCI Emerging Mkts -7.47 -14.58 9.25 Bloomberg Barclays US Agg Bond 1.64 0.01 2.06 4 generally positive earnings reports from U.S. companies. Domestic indices have regained around 5% and broad international indices are up over 4%.
S&P Timeline Investment Management
Source: FactSet
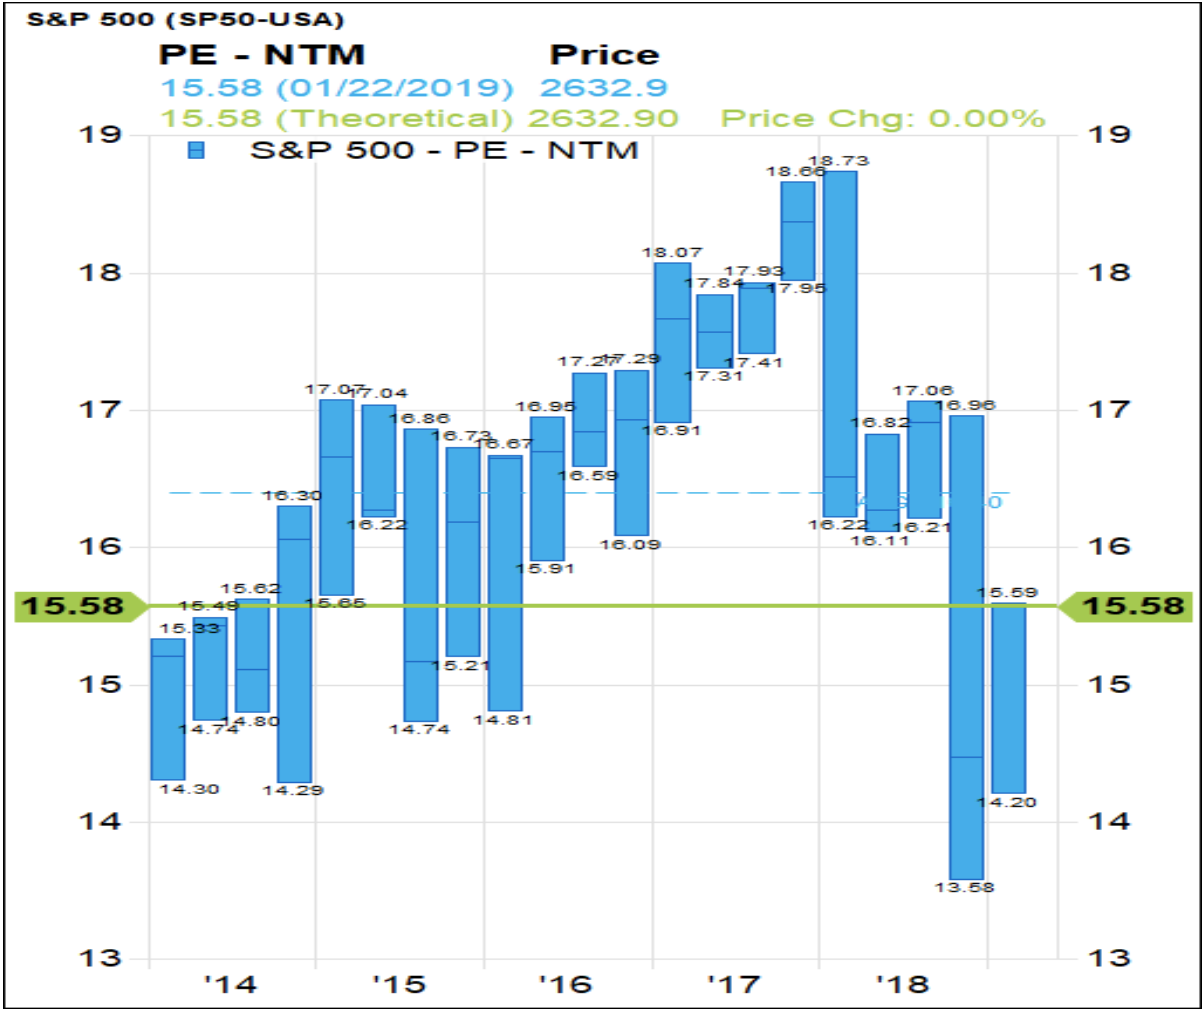
   The S&P 500 is trading at a 15.6x P/E based on the next twelve months of expected earnings. This compares with the 5-year average of 16.4x. The S&P 500 is trading at 95% of its 5-year average.
S&P Trading Fortress Asset Management
Source: FactSet
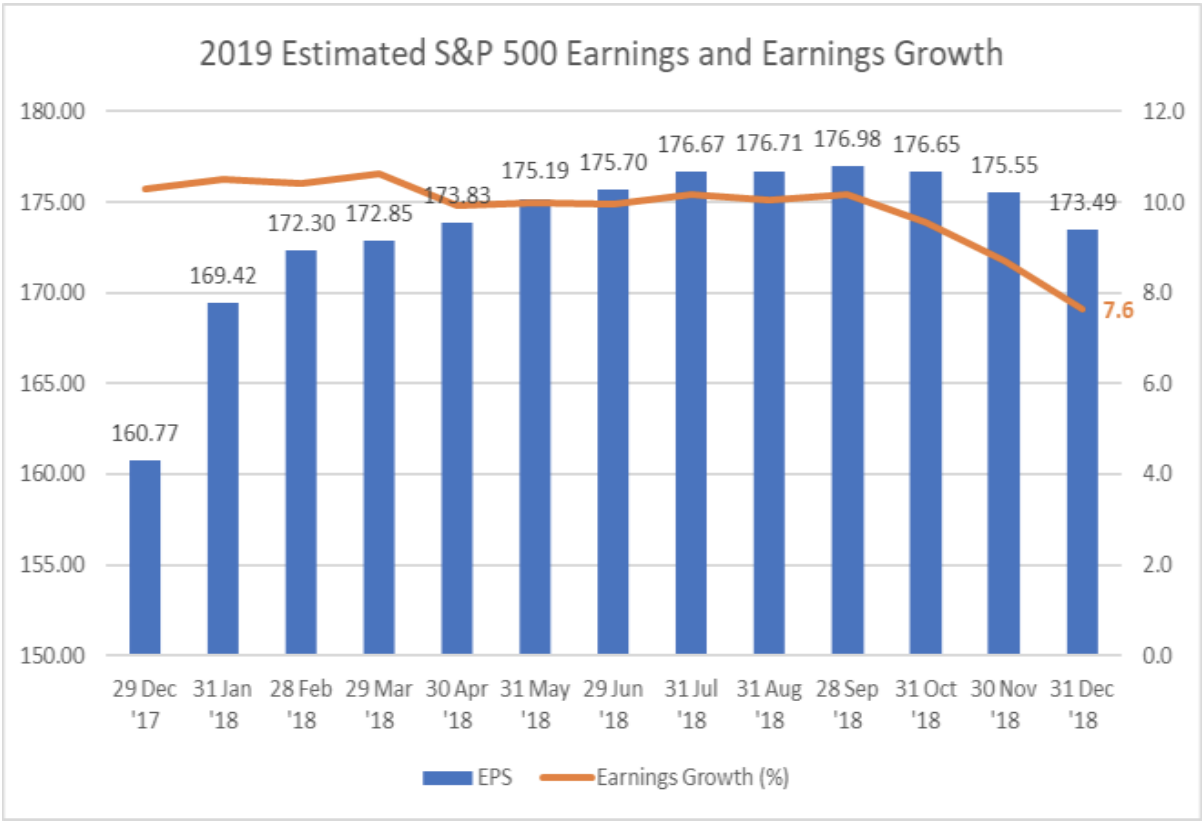
      Earnings growth is expected to be 7.6% for the S&P 500 in 2019. Estimates have been trending down since September of last year.


2019 Estimated S&P Earnings
Source: FactSet
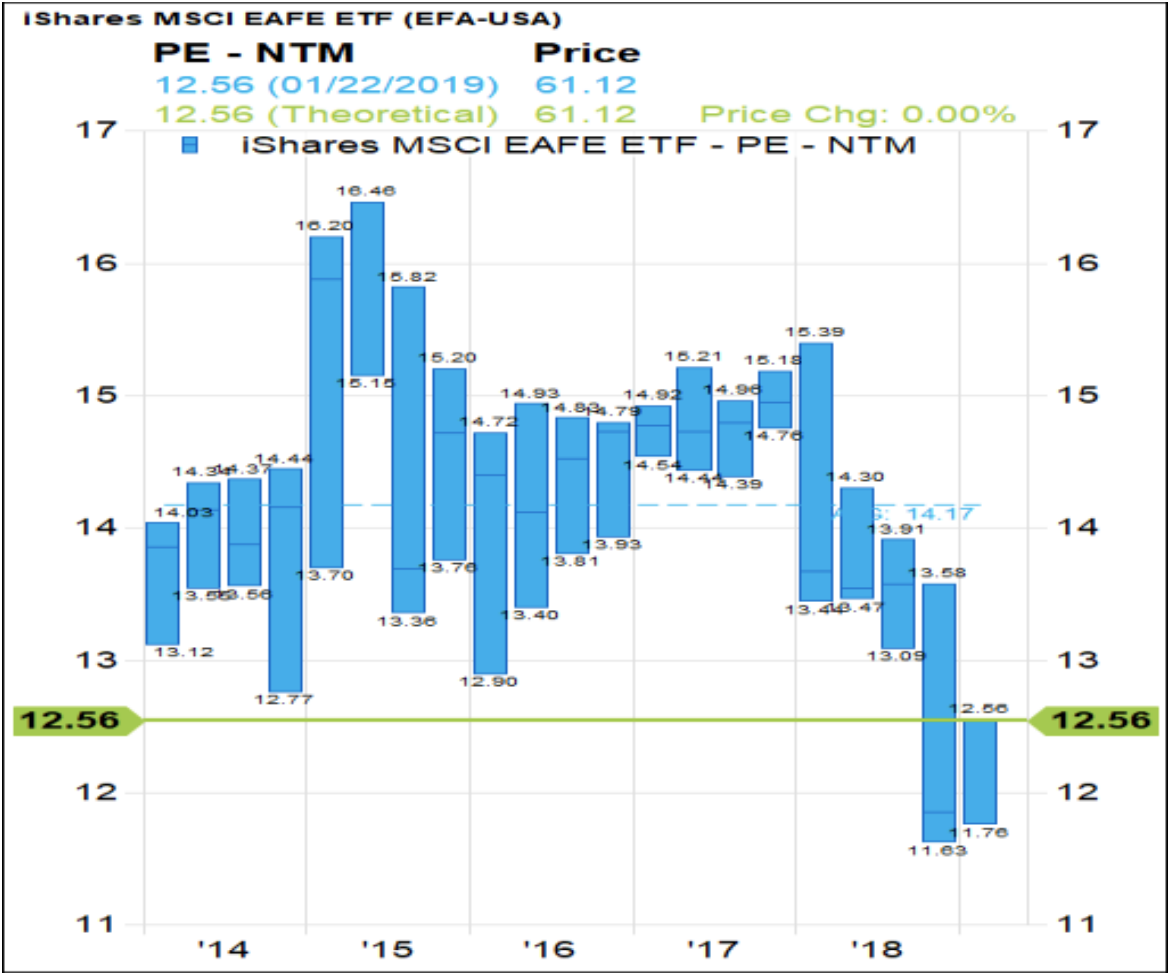
      Our 12-month forecast for the S&P 500 is 2800, indicating an upside of about 6% in addition to the 5% increase so far this year. The forecast is based on an adjusted earnings growth rate of 7.0% and a PE multiple of 16.25x. International-Developed markets are trading at 12.6x the next twelve months of expected earnings. This is 89% of its 5-year average of 14.2x.
iShares Investment Management
Source: FactSet
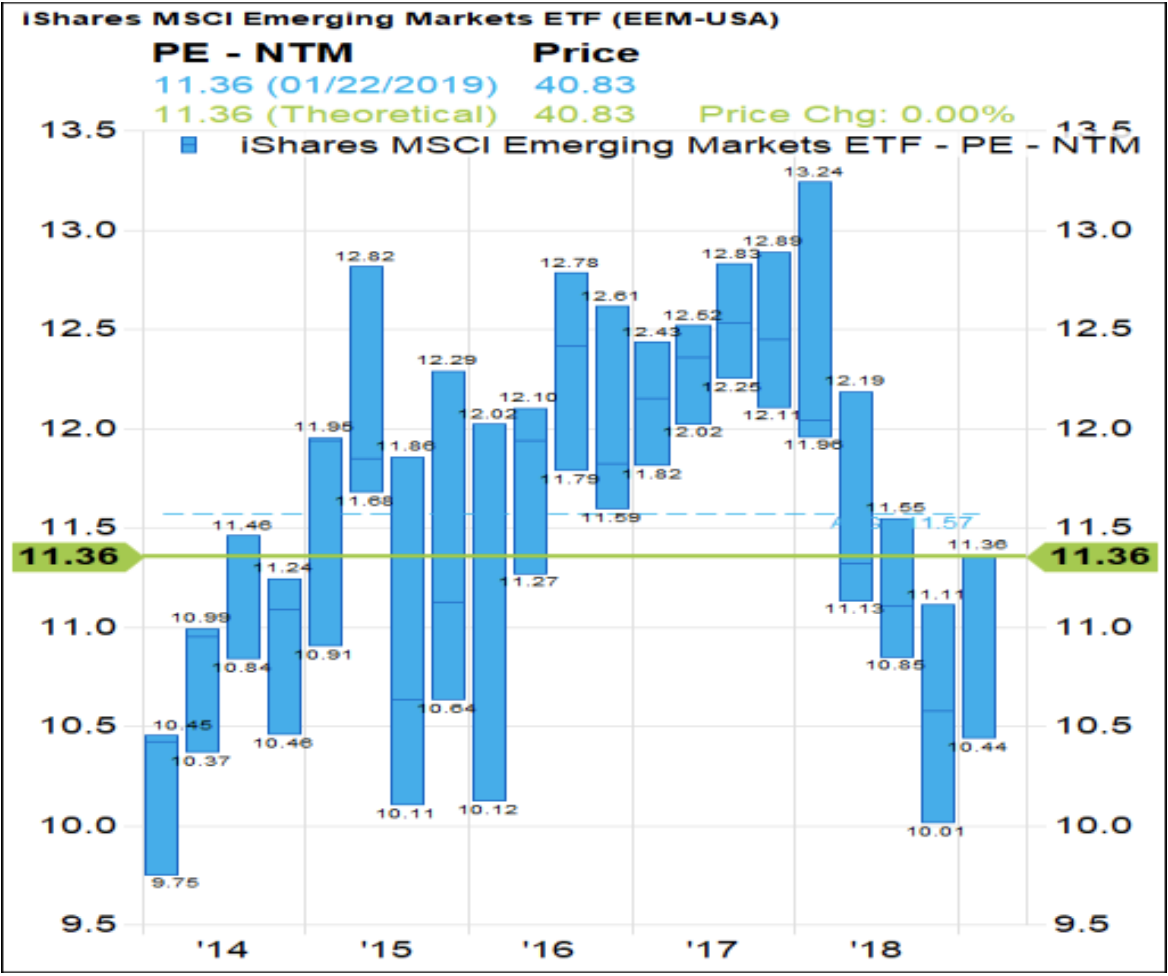
      Earnings growth is estimated to be 5.6% for International-Developed markets as represented by the MSCI EFA index. Estimates have trended down from 8.4% at the beginning of last year. International – Emerging Markets are trading at 11.4x the next twelve months of expected earnings or 98% of it 5-year average of 11.6x.

Emerging Markets
Source: FactSet
Estimates for earnings growth for InternationalEmerging Markets as represented by the MSCI Emerging Markets Index have declined to 6.2% from 10.5% at the beginning of last year.

Fixed Income Markets

      The Bloomberg Barclay US Aggregate Bond Index ended 2018 essentially flat at 0.01%. The 5-year annualized return is 2.52%. The Bloomberg Barclays Municipal Bond Index was up 1.28% for the year and 3.82% annualized for five years through 2018. Shorter benchmarks generally outpaced longer benchmarks for the year
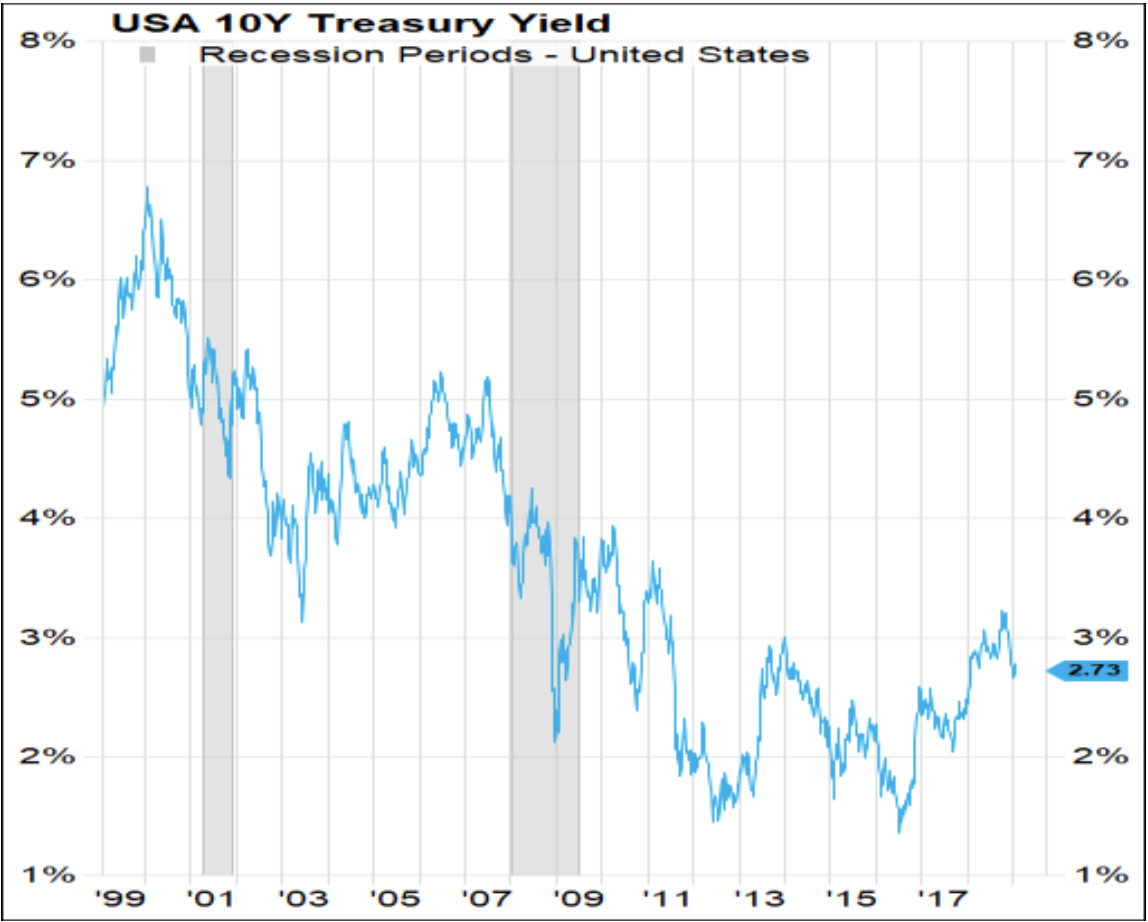
      The 10-Year U.S. Treasury closed the year at 2.74% after peaking at 3.23% in October. This compares with 2.43% at the close of 2017.

Source: FactSet
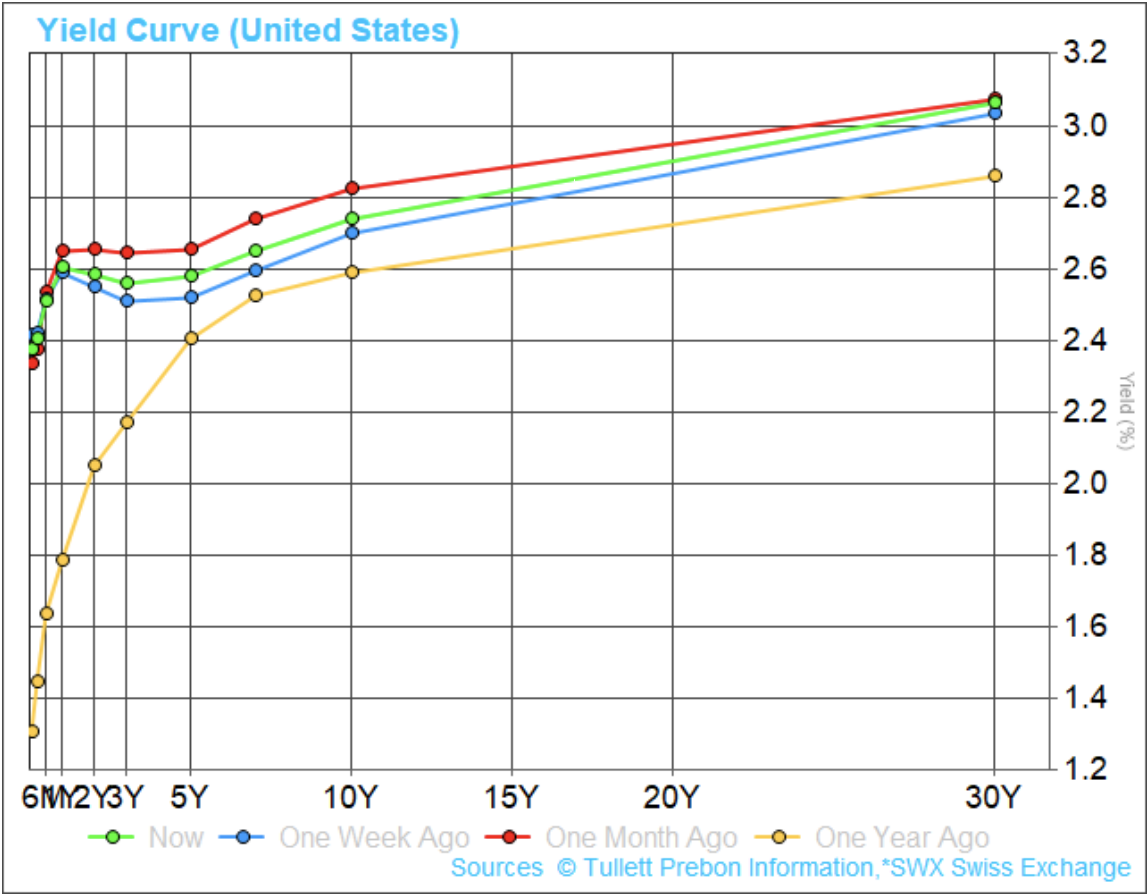
      The U.S. Treasury Yield Curve shifted higher and has become flatter over the past year in response to increases in the Fed Funds rate and due to expectations for greater inflationary pressures in the future.
Yield Curve Fortress Asset Management
Source: FactSet
      There was a flight to quality (to Treasury bonds) in the fourth quarter due to investor concern over market volatility. Corporate bond yields did not make the October-to-December yield retracement that Treasury bonds did causing spreads to widen. Credit risks did not materially change providing an opportunity in the space.

      The consensus estimate for the 10-year U.S. Treasury for year-end 2019 is 3.31%. If this does in fact come to be, intermediate and long-term bonds and funds will experience another relatively flat year. The Bloomberg Barclay Municipal Bond Index was up 1.28% in 2018. The 5-year annualized return is 3.82%. The municipal yield curve remains steeper than the Treasury curve providing more opportunity for similar maturities further out on the curve. High Yield bonds have a higher correlation to equities than other fixed income instruments. The Markit iBoxx USD Liquid High Yield Benchmark was down -1.48% for the year but maintained positive 3 and 5-year annualized returns of 6.50% and 3.22% respectively.
Disclosures

This commentary is provided for informational and educational purposes only. The information, analysis and opinions expressed herein reflect our judgment as of the date of writing and are subject to change at any time without notice. They are not intended to constitute legal, tax, securities or investment advice or a recommended course of action in any given situation. Forecasts, estimates, and certain information contained herein are based upon proprietary research and should not be considered as investment advice or a recommendation of any particular security, strategy or investment product. Investing in the markets is subject to certain risks including market, interest rate, issuer, credit and inflation risk; investments may be worth more or less than the original cost when redeemed. No part of this article may be reproduced in any form, or referred to in any other publication, without express written permission.

All investments carry certain risk and there is no assurance that an investment will provide positive performance over any period of time. Information obtained from third party resources are believed to be reliable but not guaranteed. Past performance is not a guarantee or a reliable indicator of future results. Mark Anderson, Brock Bowden, Barbara Faulkner, Mark Johnson, and Don Wiscomb are all investment advisor representatives of Dynamic Wealth Advisors, a registered investment advisor. All investment advisory services are offered through Dynamic Wealth Advisors.